Statement of Historical Performance

Regarding our Historical Performance Record. July 14 2022. *
Since 1999 Thaistocks.com has regularly published well more than 2 dozen model portfolios to members. The performance adjusted for dividends and other shareholder benefits, is always compared to the SET benchmark index, during the same 6 month time periods. I can comfortably claim that, with very few exceptions, the model beat the SET benchmark index by an overall huge margin over many years. Our long Members are the true witnesses as they followed these portfolios all along. Some 98% of members renew year after year. 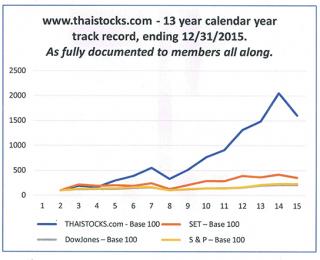
Yet, Year 2015 was a challenging one where I did not beat the SET index, the models dropping some -22% vs. the SET index dropping around -14%. You can see a graph of the models since year 2003, on the left side of our opening page and as shown in the picture graph here. To be fair I did advocate to members raising cash since mid year 2014.
For year 2006, my posted model portfolio (see below) outdid the SET index by a factor of 8 to 1. Year 2007 saw overall superior performance. Year 2008 was terrible at -40% but then 2009 an impressive recovery at overall +55%. Year 2010 show a further 50% improvement. Year 2015 was poor as above noted. After solid gains until July 2014, I did view raising cash and wrote so many times to members since mid 2014.
For a summary of periods over last decade, see this link: https://thaistocks.com/content/performance-returns-year-2000Below I show a few more examples at different times. Returns have been continuously reported to our members which are the long witness.
Year 2008 was challenging to say the least at mid year I remained bullish with my "Oil is in a bubble" conviction. The SET sank lower on the global financial crisis originating in the US. The contagion effect hit Thailand and the SET sank to a low of 380. I did not see this coming instead but then just held on as a longer term investor, collecting high dividends and riding the market back starting in the 2nd Q. 2009. I stated to members all along the financial crisis to just hang in there. Then later in 2009, I turned more cautious with a few profit taking calls, including on LVT a prominent performer for us in year 2009, but then viewed to take profit on and not go back.
One exception was in year 2003, when the SET index posted over 100% returns and our model came in just below this triple digit performance. Another exception was during 2004, where the model performance lagged the SET index due to that severe SET correction year, especially in the smaller cap sector. As noted 2015 was another year of some set back. Yet cumulatively the performance over the past 13 years is way ahead of the SET index. There have also been some brief rare periods where I did not publish a model due to being more cautious which turned out to be wise every time.
Nevertheless, all are here the same as originally posted under the link called "Portfolio Updates". If not I dare say again: active Members to our service would see inconsistencies and post such in our forum-lounge or after the model where any and all comments/questions are welcome. As regularly, I started a new now on-going model in October '09, after posting a plus 80% gain for the previous 6 months.
Here is the member link to my 6 month model ending Oct. 12 2010, showing a 39.8% return. Click here - ![]()
Here is the member link to my previous 6 month model, showing a 12.4% return. Click here - ![]()
Some previous models are accessible through this direct link, the most recent are reserved for contributing members:
On October 1 2010 a new model was published, it increased as of year end 2010, 3 times the SET index. Members can see this latest running model: Click here - ![]()
Before year 1999 I did not publish on model portfolios, instead I wrote about select individual stocks like TUF and PR and other export dominant companies which massively benefited from the Thai Baht devaluation of early July of 1997. Just after the Asian Crisis of '97, many Thai export stocks soared in value...some more then ten fold". Paul Renaud.
In the past 13 years there have been 26 different fully documented and updated model portfolios, up to date until year-end 2015. While year 2004 and 2008 were correction years and 2009 just shy of the index, the long term trend is rather clear: substantial and superior returns have regularly been achieved here and this since our inception in 1997. In late 2005 I turned maximum bullish on TICON, a stock which then rocketed up from 6 to 21 over the next 20 months. During this time I published no models only advocating to hold TICON. But since viewed taking profits as Ticon seemed to have lost its growth luster. In early 2010 I turned maximum bullish on DEMCO a stock which then roared up fivefold in the following 3 years. Since then DEMCO price corrected and I am glad I walked away long ago.
For the period before this long track record, you can see this performance disclaimer by an independent professional: Click here - ![]()
As always, we welcome all comments to paularen@gmail.com
***
During the year 2007 we had a number of impressive winning positions as members (and now free articles) can attest. Examples like DEMCO, UMS, UEC, TRC, SAT, TVO, LVT these combined resulted in over an average 50% that year. Even TISCO, CPALL, TTCL, MAJOR and CPN are prominent larger cap choices did well for us then and STPT, SGP and IVL since. In July of '07 for example, I turned far more cautious and advocated profit taking on several occasions to our members... Less volatile then the SET its all been a long demonstration to new wealth creation. All this shows an active approach in the volatile Thai stock market.
Anyway, as of early 2010, here is a year to year recap, with original member comments postings:Click here - ![]()
More...on performance.
A short but fair history on performance over the past years, since our inception.
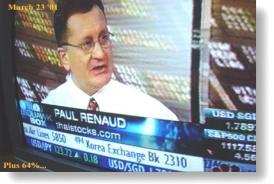
The longest running model portfolio was the "Original 30" portfolio which was tracked for over three years. This was the model shown 2 different times on my 4 separate CNBC TV interviews, starting in April of 1999. Here was a table of 30 value stocks picked purely on low valuation besides high dividend prospects, rather then large market capitalization. I show the "original 30" final performance tabulation summary link further below.
As for the latest results:
The year 2005 model portfolio returned 85.4%, for the one year time period from Nov 1 2004, to Nov 1 2005, by far beating the SET index. On November 1, I reformulated the model and showed a further 4.37% increase in value, up until December 31 '05.
On January 2 2006, I started a new model with 15 different stock selections. I there clearly identified select choices which performed most favorably, in hindsight. Then, mainly due to strong price advances on these favorite selections and the sudden political turmoil, I decided to terminate this model with a 30%+ gain, for the 1st quarter, as posted here on April 1 '06.
You can see this model, now ended, at this link: Click here - ![]()
Then on June 23 '06, I started a new model portfolio called the "strong buy" model. With a near 23% return, here I show an out-performance of 8:1 compared to the SET index during the same time.
You can see this at this link: Click here - ![]()
Then there was Ticon, my "strongest buy view" stock pick since starting this web site. On October 27 '04, I here posted a "maximum bullish view" on Ticon Industrial Connection ("Ticon" is listed in the property sector), at the then market price of 6 Baht per share. I viewed this single choice to be "my best pick in many years" -as I felt the general Thai market in 2005 would be an uneventful year. The only time sine 1997 in which I rated any stock with "a strongest buy view", except again in February of 2010 when I posted a strongest buy view on DEMCO.
www.achive.org has the record on some of ts.com's long history.
You can see evidence on this at archive.org:
http://web.archive.org/web/20041110043203//
Ticon traded for several weeks after Oct. 27 between 5.95 and 6.5 Baht per share before rising in December '04. I wrote-up many different research articles on Ticon over the past 2 years since, articulating and explaining why this company was/is such an exceptional strong choice. Many of these are articles are now available for all to see. I updated members on this favored choice every quarter and then expanded on it with more selections starting in June of '05, and again in November of 05.
Ticon then more then tripled in price, beating the SET benchmark index by a huge margin. I re-affirmed my strong buy view when Ticon shares price corrected to around 8-9 Baht in mid July 2005. As of mid January '07, this selection traded around 17 Baht per share and in addition paid 1.80 in cash dividends each, over the past 2 years. I recently changed my rating view from a "strong buy" to a "long term buy" as I still like this core selection despite its immense appreciation but then in 2008 turned bearish on it.
The 10 years of performance models' show that a carefully chosen group of Thai value stocks that focus on strong business fundamentals, high dividends and low p/e ratio's, can easily & fairly regularly over time outperform the tilted bank, energy and volatility laden SET benchmark index.
None of these model portfolios are meant to be individual investment recommendations to you, but instead show how rational investors with here shown choices can beat the SET index. This by focusing on fundamentally strong companies which pay high cash dividends, rather then just share liquidity or trading appeal.
* I here have shown again and again significant wealth creation in the making -since 1997. For sure I have also chosen stock selections over time which dropped in price, some even substantially but the combined long record is unmistaken. However, in early 2018 smaller and mid cap stocks went into a long bear market which lasted until early 2020. These were poor years and I stopped accepting all membership contributions. However in April of 2020, with the SET index reeling due to Covit-19, I turned max bullish right at the major bottom and stated so at my front page. Since then outperform the SET index with new stock models, but now with a set back since March 2022, due to the dire War on Ukraine, rocking-up oil prices and interest/inflation rates moving-up. To be fair I did write and see US interest rates to be turning higher by year end 2021, and became more market cautious due to that. Most of all I always here wrote, many times, to take profits anytime a stock rocks up 50%. Since April 2020, a number of my selections have rocked up some even 100%, giving ample chance to nail down good profits.Since 1997, I spend intermittently many weeks every year in Bangkok regularly visiting in person on many companies I follow. Overall these choices are less volatile and often perform considerably better, then the larger capitalized SET stocks, as here shown again and again since 1997. The problem can be share liquidity but this is often a moot issue to individual investors and when the stock price wakes-up, share trading-volume just about always soars. Most of all I always here wrote, many times, to take profits anytime a stock rocks up 50%.
I certify that the above is true and correct and to the best of my knowledge a fair presentation as has been posted for members here regularly and un-interrupted since April 30 of 1997.
Best Regards,
Paul A. Renaud.![]()
www.thaistocks.com
The "Original Top 30" model portfolio, as summarized below: See this link for the full original table: Click here - ![]()
You can see this link here for the full performance tabulation: Click here - ![]()