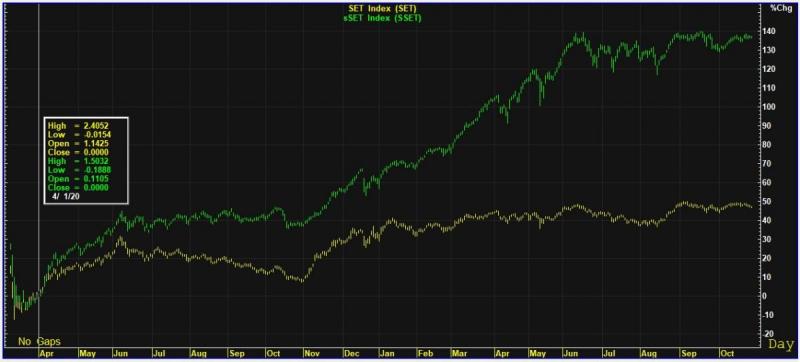
The graph shows it and then some, sSET vs. SET index.
Below you can see the graph on how sSET Index, which represents "the price movement of common stocks apart from constituents in the SET50 Index and SET100 Index", performed, vs. SET benchmark index. This shown from the outset of Covit-19 April 1 2020, which was start of the lock downs. Nearly 3 to 1 outperformance! Likely not even dividend adjusted, as on average sSET companies pay higher dividend yields, vs. large cap's. The impressive resurgence comes post the period 2017 to start of this graph April 1 2020, where smaller cap stocks under-performed considerably back then as retail investors dwindled. Now clearly changed -and likely to remain so- on ever more retail investors (the numbers show it) taking their investments/savings in their own hands on more time at home along on-line trading, made so easy. Also high tax favored dividends vs. bank savings accounts....along with many's disappointments on very low rental yields on BKK condo's. All in anticipation year 2022 will be an economic recovery period.
For the record, on April 4th 2020, I turned maximum bullish with my long held bias of smaller cap's -and stated so here in full at the top of the front page -thaistocks.com!