Bears vs. Bulls ratio, an extreme reading worth paying attention to.
Students and investors of stock markets know that the opposite often happens compared to what the majority in the market think. Its called the contrarian view. This makes sense because if most investor/traders sold out their positions on fear, they then express they are bearish (meaning they think the stock market is vulnerable to a set back) as this is why they sold out. The opposite is so also true, if most experts/traders and others believe the market is undervalued and so will likely to rise, this is often wrong as most already invests and there is no buying power left.
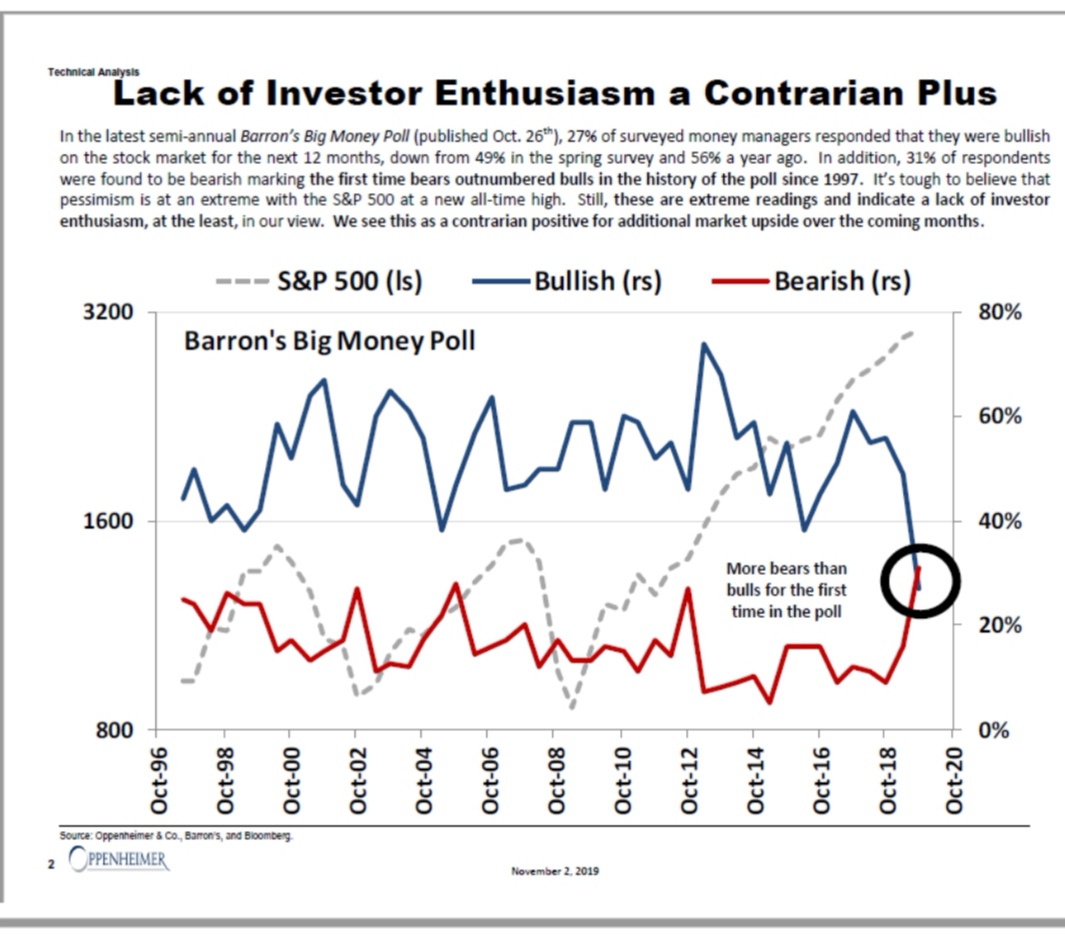
All kinds of investors and traders look at the bull vs. bear ratio to gauge what the future may bring based on this ratio. At extremes I think this makes much sense and is another reason why we can't just employ traditions valuations methods to stocks. Sentiment and bull vs. bear ratio can and do make a big difference. The below graph (from US broker Oppenheimer) just shows the extreme point we are now at (the email will not show this, please click on link below), what is particular striking is that this graph goes all the way back to 1997, a long, long time. All records are broken on this contrarian indicator! Just too many, experts and others are recently calling for a major US market downturn, a recession and global malaise etc...for that to pan out. Similar in Thailand most have given up, and that could be the contrarian indicator to tell us the opposite would/could well happen. Of course Thailand does not have such bull to bear ratio numbers published or otherwise, as the market is just too small but I gauge lots of us, me included, are very discouraged and that just may signal a market bottom has arrived and we won't see below 1600 on the SET again.